Current Investor and Corporate Owned Homes in Fort Worth and Tarrant County Full Data Breakdown by City, ISD, and Top Owners
There has been growing concern across North Texas about how much of the housing inventory is owned by investors, corporations, and large entities rather than owner occupants. News stories, social media posts, and public meetings often reference broad estimates or partial figures, which can make it difficult to understand what is actually happening on the ground.
This page provides a current, transparent breakdown of investor and corporate ownership of single family homes in Fort Worth and across Tarrant County. The data is presented in a way that allows anyone to see not just overall percentages, but where investor ownership is concentrated and who the largest owners are by name and property count.
The goal is not to put verifiable numbers in one place so readers can draw their own conclusions.
WHAT THIS DATA INCLUDES
This spreadsheet analyzes single family residential properties and identifies investor owned homes using ownership patterns rather than headlines or assumptions.
For the purposes of this analysis, investor owned properties include homes held by individuals or entities that own three or more residential properties. This approach helps separate owner occupants and very small landlords from larger scale investors, while still capturing both local and national ownership structures.
The data is broken down into four main views:
• Total investor owned properties by city
• Total investor owned properties by school district
• Percentage of investor owned homes relative to total housing stock
• Ranked lists of the largest owners by number of properties held
KEY CURRENT NUMBERS AT A GLANCE
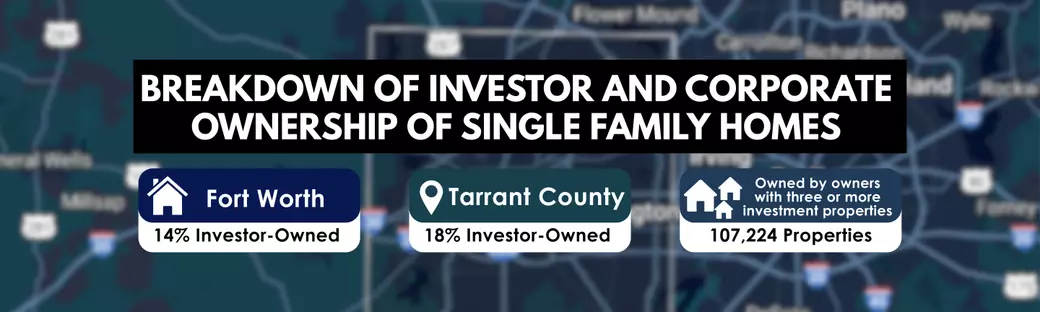
Fort Worth
Total single family residential properties: 251,292
Investor owned properties: 36,387
Investor ownership share shown in city level data: approximately 14 percent
Properties owned by owners with three or more investment properties: 40,827
Tarrant County
Total single family residential properties: 592,351
Investor ownership share shown in county level data: approximately 18.1 percent
Properties owned by owners with three or more investment properties: 107,224
These figures illustrate the difference between two commonly confused concepts. Share of homes owned is not the same as share of homes purchased in a given year. This page focuses on ownership, not transaction volume.WHY THE CITY AND ISD BREAKDOWNS MATTER
Citywide averages often hide meaningful differences between areas. Breaking investor ownership down by city and by school district provides a clearer picture of where concentration is higher or lower.
School district data is especially useful because it closely aligns with neighborhood boundaries and long term household decision making. Many discussions about affordability and displacement focus on specific districts, not just entire cities.
This dataset allows readers to see how investor ownership varies across Fort Worth, Arlington, Keller, Mansfield, and surrounding districts, rather than relying on a single headline number.
TOP OWNERS AND OWNERSHIP CONCENTRATION
One of the most common questions in public discussions is simple: who actually owns these houses?
The Top Fort Worth Investors and Top Tarrant County Investors tabs rank owners by the number of single family properties they control. This includes large national platforms, regional investment groups, and structured LLC ownership entities.
Seeing ownership ranked by count helps move the conversation from general claims about corporations to specific, verifiable ownership patterns. Readers can see whether ownership is widely distributed among many mid sized owners or concentrated among a smaller number of very large ones.
IMPORTANT CONTEXT AND COMMON MISUNDERSTANDINGS
Several terms are often used interchangeably in public debate, even though they are not identical.
Investor owned does not always mean Wall Street or out of state. Some investors are local individuals or families who own multiple homes.
Corporate owned does not always mean a publicly traded company. Many properties are held in LLCs for legal or financing reasons, including by smaller operators.
Commercial ownership and investor ownership are not the same metric. Some official reports classify ownership strictly by entity type, while this dataset focuses on ownership scale and concentration.
This spreadsheet is designed to make those distinctions visible rather than collapsing them into a single talking point.
HOW TO USE THE SPREADSHEET
You can sort and filter the data to answer specific questions, such as:
- Which cities have the highest share of investor owned homes
- Which school districts show higher or lower investor concentration
- Who the largest owners are in Fort Worth specifically
- How Fort Worth compares to Tarrant County as a whole
METHODOLOGY NOTE
This analysis is based on current ownership records and grouping logic applied consistently across Fort Worth and Tarrant County. Like any large dataset, it reflects the structure of public records and ownership entities at the time of analysis.
No attempt is made here to assign intent, motivation, or policy conclusions. The focus is on ownership patterns and transparency.
CLOSING
Debates about housing affordability, investor participation, and local policy are unlikely to slow down. Meaningful discussion requires shared facts.
This page exists to provide those facts in a clear, accessible way so residents, policymakers, journalists, and researchers can reference the same numbers and have better informed conversations about housing in Fort Worth and Tarrant County.
- Access the full spreadsheet here. To edit the spreadsheet, open it then click file > make a copy
Categories
- All Blogs (120)
- Basics (17)
- Buyer Psychology (3)
- Career (1)
- CCR in the News (14)
- Community (23)
- Downsizing (3)
- Election (6)
- Financial Advice (14)
- Foreclosure (1)
- Heritage Subdivision (3)
- Home Refinancing (4)
- Home Search (2)
- How-to (22)
- HUD Homes (2)
- Just for fun (10)
- Legislative Involvement (6)
- Making an offer (5)
- Mortgage (2)
- Negotation (4)
- Preparing to Sell (10)
- Print media (3)
- Property Tax (53)
- Real Estate Market Report (26)
- Robert Montoya (1)
- Sell (1)
- Senior Housing (1)
- State (5)
- Static (1)
- TAD Reform (8)
- Tarrant County (15)
- Testifying (2)
Recent Posts